

Confusion Matrix in Machine Learning
Classification metric in supervised learning


Why this metric named as confusion matrix?
From my point of view, the matrix term refers to row and column, the confusion term refers to the thought of the machine that didn’t classify 100% accurately. Let’s learn about the confusion matrix a little deeper in this article. It is a combined metric of classification to visualize the performance of the model.
The topics we will cover in this article are shown below:
- Confusion matrix
- Type 1 and Type 2 Error
- Accuracy
- Precision
- Recall
- False omission rate
- F1-score
MCC or phi coefficient
Confusion Matrix:
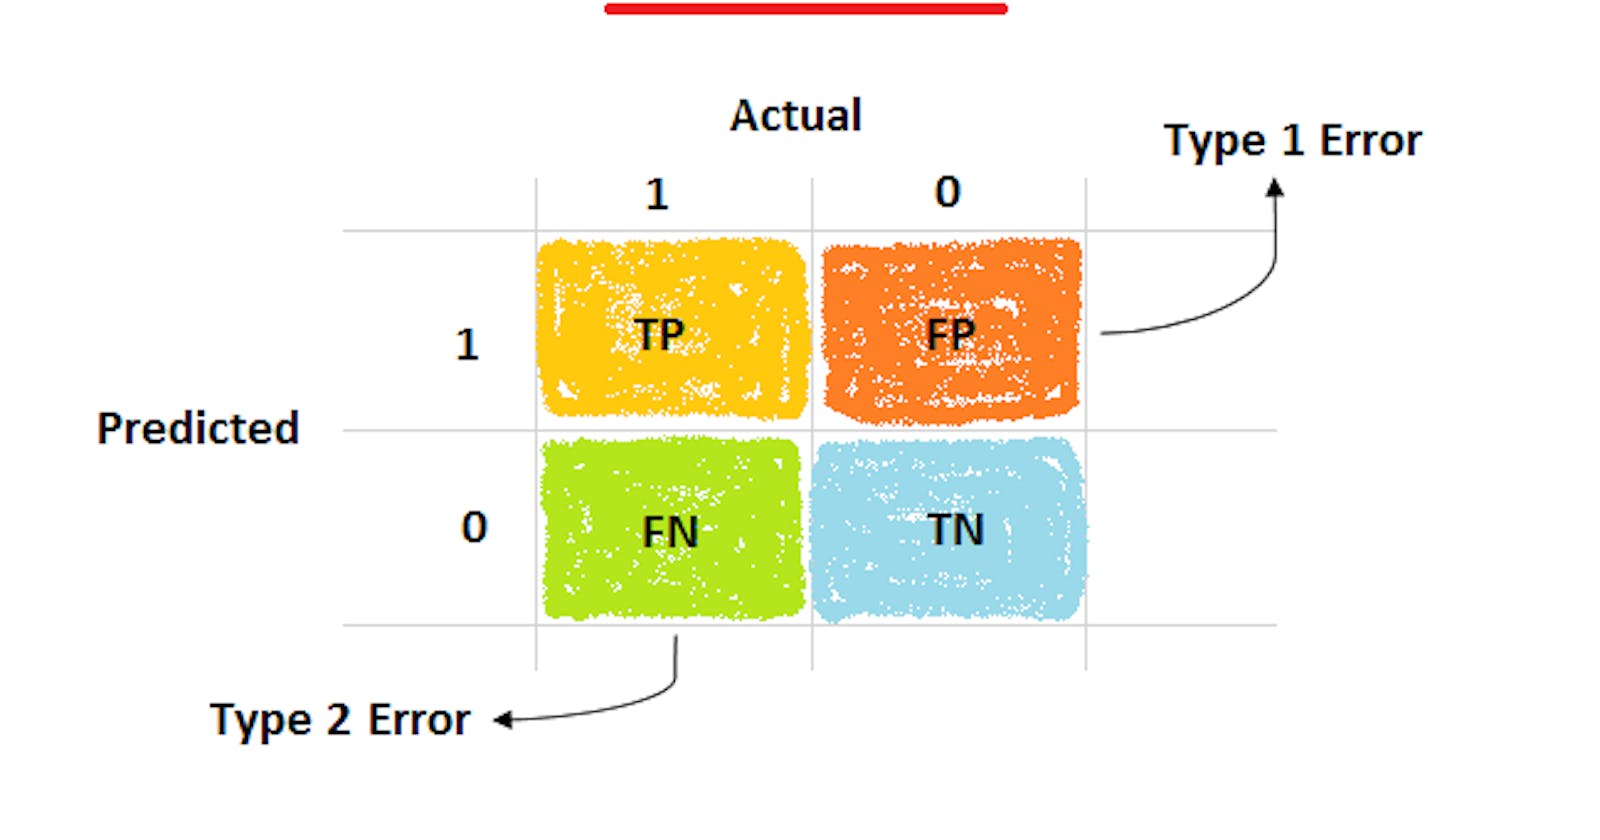
The confusion matrix gives very fruitful information about the predicted performance of the estimator or model that use in machine learning. Let’s see a confusion matrix.
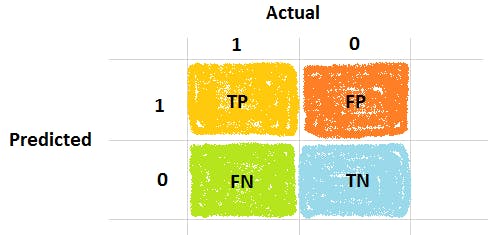
What is inside the confusion matrix? So much information.
Actual values are true binary values “0” and”1". The prediction value that comes after fitting the model is also confusing because it is not predicted all values properly. So, these four terms are born to know the evaluation performance.
- TP is a true positive value means the predicted value is the same as the actual value.
- FP is a false positive value means the actual value is “0” but it predicted “1”.
- FN is a false negative value means the actual value is “1” but it predicted “0”.
- TN is a true negative value means the actual value is “0” and the model predicted it the same also.
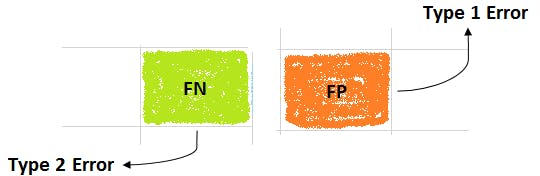
Type 1 and Type 2 Error: These two type error comes when the model does not predict all the data point accurately and some of the points are misclassified that leads to some error.
- Type 1 error: This error occurs when the actual value is “0” but it predicted “1”. In statistics term, this error tells the level of significance (α) i.e. alpha. The value of alpha is chosen by us so, the error depends on what value we choose.
- Type 2 error: This error occurs when the actual value is “1” but it is predicted “0”. In statistics term, this error named is beta and it is mainly dependent on the sample size(n) and variance(σ).
- Accuracy: It is defined as the closeness or exact of predicted value to the actual value.
Formula:
Accuracy = (TP + TN)/(TP + TN + FP + FN)
- Precision: Precision is defined based on true positive values only out of all positive values.
Formula:
Precision = TP/(TP + FP)
- Recall: It is also known as sensitivity or hit rate or true positive rate. It tells that how good our estimator or model to predict the positive values.
Formula:
Recall = TP/(TP + FN)
- False omission rate: The false omission rate is defined as the occurrence of false-negative values to total negative values predicted as false and true.
Formula:
FOR = FN/(FN + TN)
- F1-score: This score is also a harmonic mean of precision and recall. The F1 score tells the accuracy in terms of precision and recall. When we were reading about the central tendency article the harmonic mean is usually use for outliers. Well, this score is more suitable for the business problem which has more dispersion. It is useful in imbalanced classes.
F1 score is more important in terms of false negative and true negative values.
Formula:
F1-score = 2precisionrecall/(precision+recall)
- MCC or phi coefficient This metric is useful in machine learning to know the performance quality in binary classes. The MCC stands for the Matthews correlation coefficient.
Formula:
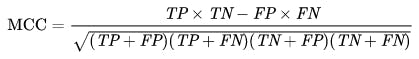
Final Notes:
I hope you learned something! If there is anything that you guys would like to add to this article, feel free to leave a message and don’t hesitate! Any sort of feedback is truly appreciated. Don’t be afraid to share this! Thanks!